| EGN 3443 Probability and Statistics for Engineers | ||||||||||||||||||||||||||||||||||||||||||||||||||||||||||||||||||||||||||||||||||||||||||||||||||||||||||||||||||||||||||||||||||||||||||||||||||||||||||||||||||||||||||||||||||||||||||||||||||||||||
|
Hui Yang
This course presents the theory and methods of probability and statistics models needed to support engineering decision making. The course objectives include:
|
||||||||||||||||||||||||||||||||||||||||||||||||||||||||||||||||||||||||||||||||||||||||||||||||||||||||||||||||||||||||||||||||||||||||||||||||||||||||||||||||||||||||||||||||||||||||||||||||||||||||
|
Bayes Theorem |
||||||||||||||||||||||||||||||||||||||||||||||||||||||||||||||||||||||||||||||||||||||||||||||||||||||||||||||||||||||||||||||||||||||||||||||||||||||||||||||||||||||||||||||||||||||||||||||||||||||||
|
1. Suppose there is a rare cancer disease, the probability of a randomly selected person people to get this cancer is 1/10000. And suppose there's a lab blood test for this cancer that is 98% accurate in the sense that 98% of those who have the cancer will test positive, but the lab blood test also show positive for 2% of those who do not have such a cancer disease.
If a randomly selected person takes the lab blood test and the result is positive, what is the probability that he really has this cancer?
Let's see the following confusion matrix (What a good name? :)
True positive: Diseased people correctly tested positive False positive: Healthy people wrongly tested as positive True negative: Healthy people correctly tested as negative False negative: Diseased people wrongly tested as negative
Note: false positive rate and false negative rate are not necessarily the same. They are both 0.02 in this example for simplicity.
Knowing that you tested positive increased your probability of having the disease from 0.0001 to 0.004877, but not all the way to 0.98.
2. Let's go back and look at what would happen if 60% of the original population had the disease (not 1/10000 any more). When the prevalence of the disease is 0.60, the probability of having the disease given a positive test result is
If the prevalence of the disease is 60%, then knowing that you tested positive increased your probability of having the disease from 60% to 98.6577.
3. What kind of prevalence of the disease will make P(disease | positive) = P(positive |disease) if the lab test results remain the same?
0.98*x 0.98 = ---------------------------------- ( solve this equation for x - prevalence of the disease) 0.98* x +0.02*(1- x)
4. Bulls mind-expanding: If a randomly selected person tests negative, what is the probability that he does not have the disease?
|
||||||||||||||||||||||||||||||||||||||||||||||||||||||||||||||||||||||||||||||||||||||||||||||||||||||||||||||||||||||||||||||||||||||||||||||||||||||||||||||||||||||||||||||||||||||||||||||||||||||||
|
Discrete Random Variables and Probability Distribution |
||||||||||||||||||||||||||||||||||||||||||||||||||||||||||||||||||||||||||||||||||||||||||||||||||||||||||||||||||||||||||||||||||||||||||||||||||||||||||||||||||||||||||||||||||||||||||||||||||||||||
|
Rolling Two Fair Dice |
||||||||||||||||||||||||||||||||||||||||||||||||||||||||||||||||||||||||||||||||||||||||||||||||||||||||||||||||||||||||||||||||||||||||||||||||||||||||||||||||||||||||||||||||||||||||||||||||||||||||
|
1. List all possible outcomes (a,b) of rolling the two dice. Let a denote the number on the top of the first die and b the number on the top of the second die. Note that each of a and b can be any of the integers from 1 through 6.
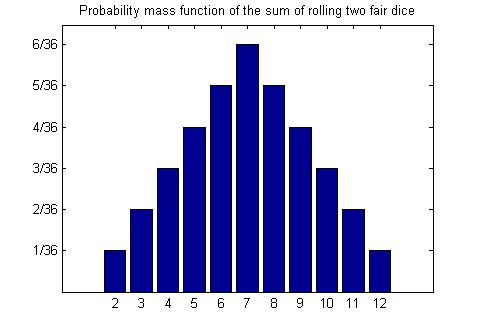
2. Assume that the random variable X is the sum of the values shown after the throw of two dice. What would the probability mass function (PMF) f(x) be like?
Table of probability mass function (PMF) f(x) of rolling two fair dice
P(X=x) on the y-axis vs. x on the x-axis 3. Calculate the mean E(X) and variance V(X).
|
||||||||||||||||||||||||||||||||||||||||||||||||||||||||||||||||||||||||||||||||||||||||||||||||||||||||||||||||||||||||||||||||||||||||||||||||||||||||||||||||||||||||||||||||||||||||||||||||||||||||
|
4. Please find the probability that the sum of rolling two fair dice is less than or equal to a certain value, fill out the following table, and draw the graph for F(x).
Cumulative Distribution Function of the sum of rolling two dice |
||||||||||||||||||||||||||||||||||||||||||||||||||||||||||||||||||||||||||||||||||||||||||||||||||||||||||||||||||||||||||||||||||||||||||||||||||||||||||||||||||||||||||||||||||||||||||||||||||||||||
| Confidence Interval | ||||||||||||||||||||||||||||||||||||||||||||||||||||||||||||||||||||||||||||||||||||||||||||||||||||||||||||||||||||||||||||||||||||||||||||||||||||||||||||||||||||||||||||||||||||||||||||||||||||||||
|
A machine is set up such that the average content of juice per bottle equals μ. A sample of 100 bottles yields an average content of 48oz. Calculate a 90% and a 95% confidence interval for the average content. Assume that the population standard deviation σ = 5oz.
90%: |
||||||||||||||||||||||||||||||||||||||||||||||||||||||||||||||||||||||||||||||||||||||||||||||||||||||||||||||||||||||||||||||||||||||||||||||||||||||||||||||||||||||||||||||||||||||||||||||||||||||||
|
What sample size is required to make sure the margin of error (MOE) is within 0.5oz at the 95% confidence level? (±0.5 oz) Assume that the population standard deviation σ = 5oz.
n = (1.96*5/0.5)2=368.64~369 |
||||||||||||||||||||||||||||||||||||||||||||||||||||||||||||||||||||||||||||||||||||||||||||||||||||||||||||||||||||||||||||||||||||||||||||||||||||||||||||||||||||||||||||||||||||||||||||||||||||||||
|
Hypothesis Testing |
||||||||||||||||||||||||||||||||||||||||||||||||||||||||||||||||||||||||||||||||||||||||||||||||||||||||||||||||||||||||||||||||||||||||||||||||||||||||||||||||||||||||||||||||||||||||||||||||||||||||
|
A machine is set up such that the average content of juice per bottle equals μ. A sample of 36 bottles yields an average content of 51.5oz. Test the hypothesis that the average content per bottle is 50oz at the 5% significance level. Assume that the population standard deviation σ = 5oz. Classical approach: Steps:
P-value approach: Steps:
|
||||||||||||||||||||||||||||||||||||||||||||||||||||||||||||||||||||||||||||||||||||||||||||||||||||||||||||||||||||||||||||||||||||||||||||||||||||||||||||||||||||||||||||||||||||||||||||||||||||||||